01
The people you miss
Every extra shift is time taken from someone you love: a mother who is aging, a child who is growing, a partner who needed you there.
Currency conversion is a fixed snapshot. Rates last updated Sep 8, 2026.
Important: every number on this page represents billionaires only. Millionaires are not included—even though some are close enough to become billionaires. What could society keep public if we prevented that next concentration, too?
Not what billionaires can buy. How much human time their fortunes are worth.
What this measures: the labor-time equivalent of extreme wealth — how many human working days it would take to earn these sums.
What it does not claim: that these dollars came out of your paycheck. Most of them did not. That is the harder point: fortunes at this scale grow without anyone working for them, so the ordinary rules of earning never applied to them at all.
This counter starts with 8 hours already on the clock, then keeps counting while this page is open—not because these billionaires are working for it, but because existing wealth can grow through investment returns and interest. Illustrative assumption: 4% annual growth, applied evenly across the year. This is not a live market feed.
At that pay, an 8-hour day is $165.36. In the selected wealth pool, that wealth grows by $0.00 in the same eight hours. To earn that at your wage would take not calculable. Nobody worked those hours.
As the counter runs, that same gain equals 0 days of your work.
An illustrative, country-adjusted basket: recurring costs shown as one year, plus one-off major care, the things people postpone rather than buy — debt payoff, a deposit, retraining, an earlier retirement — and a few deliberately absurd items for scale. The money is investment growth on existing wealth, not wages. These are unrealized asset gains, not cash on hand — converting them to spending would require selling, with tax and price effects not modelled here. As the counter grows, matched items move into “Matched by.”
The full project dataset counts people from countries around the world. To make that scale human-sized, we translate dollars into one simple unit: an eight-hour minimum-wage workday.
Wage basis: $7.25/hour × 8 hours. Net worth is not cash, and this is a labor-time comparison—not a claim that these dollars were literally taken from paychecks.



Current snapshot dated Sep 8, 2026.
Historical context: Forbes’ comparable worldwide billionaire list begins in 1987. This page does not interpolate the missing years.
The point is not that a different past can be proven. The point is that a different compounding path can be made visible.
“A safer car. Better food. A medical bill paid. A home within reach.”A family’s quality of life can turn on income that arrives—or never arrives—over thousands of ordinary days.
would sit above a $1 billion ceiling for 3,414 people—about 297.5 billion people working one 8-hour day.
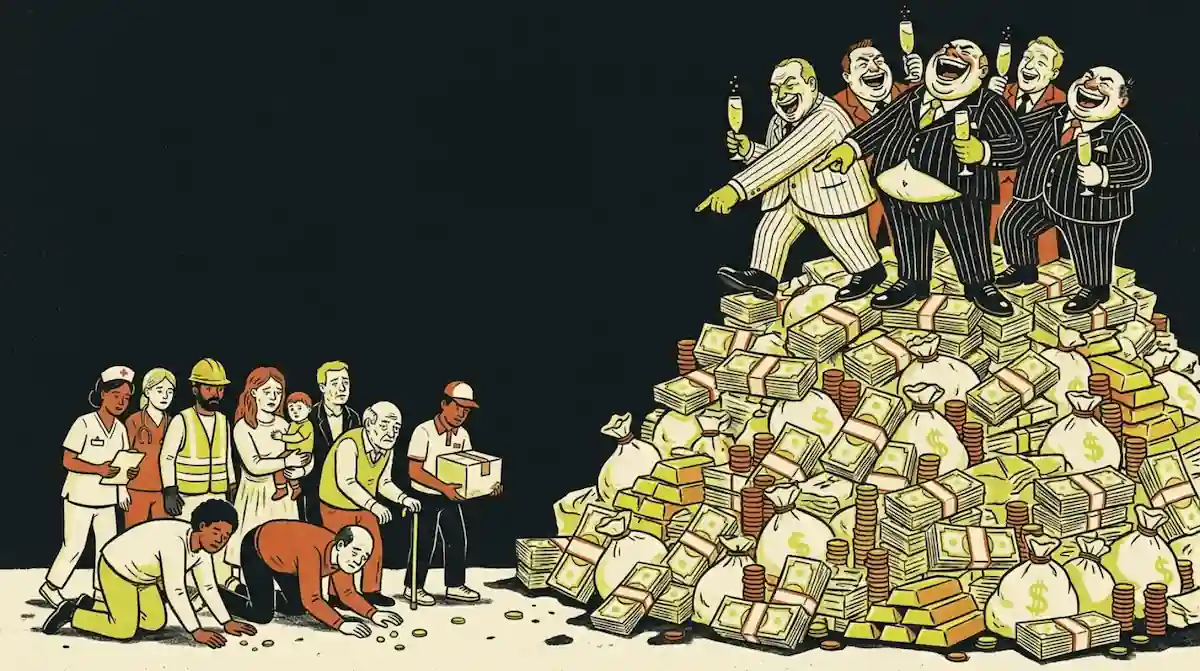
Private wealth compounds into power. Public wealth could compound into time.
Ownership, political influence, housing speculation, tax advantages, and inheritance keep the gains circulating upward.
A plausible alternative could fund housing, healthcare, childcare, disability support, infrastructure—or simply fewer hours at work.
It is the time you never get back. The afternoon you did not spend with your mother before she died. The years you were too exhausted to be present while your children were small. The appointment you postponed, the meal you missed, the grief you carried back to work because the bills would not wait. When a society makes ordinary people trade their lives for basic security, the loss is measured in memories—not just dollars.
Every extra shift is time taken from someone you love: a mother who is aging, a child who is growing, a partner who needed you there.
When pay and services fall short, families absorb the gap through debt, postponed care, unsafe housing, and impossible tradeoffs.
A fortune can keep shaping markets, media, policy, and inheritance long after the original work is done.
A one-time tax on billionaire wealth could turn private hoards into public capacity. This is an illustrative allocation of the selected billionaire pool—not a budget forecast, and not a claim that one windfall alone permanently pays recurring bills.
A permanent endowment for guaranteed income, deeply affordable housing, supportive services, childcare, and the public systems that keep people housed.
Primary care, vaccines, medicines, clean water, screening, mental-health care, and research that reduces preventable illness before it becomes a catastrophe.
Stable housing, youth programs, violence interruption, addiction treatment, restorative justice, and well-resourced communities—prevention before punishment.
Frequent buses and trains, safe sidewalks and bike routes, accessible stations, and reliable service that connects people to work, school, care, and one another.
Climate resilience, schools, libraries, democratic capacity, and the next public need we should not have to beg a billionaire to fund.
Illustrative allocation of $0.00: 35% poverty and housing, 25% health, 10% safety, and 20% transportation; the remaining 10% is reserved for public resilience and democratic capacity. The point is not a promise that money solves everything. The point is that private accumulation is a choice about what never gets built.
The federal minimum wage has been $7.25 since July 2009 — the longest stretch without an increase since the wage was created, at 17 years and counting. It is not indexed to anything. Prices rose; the floor did not move.
So before asking what a missing income would have done for a household, there is a prior question: what did the wage that was actually paid stop being worth? A worker whose pay had tracked productivity would have earned roughly $23,400 more a year — close to $400,000 across the years the floor has sat frozen. That money was never taken out of a paycheck. It simply never became one.
Sources: U.S. Department of Labor ($7.25 effective July 24, 2009); Economic Policy Institute (40.2% below the February 1968 peak); EPI (productivity-indexed ≈ $18.50/hr; CEPR puts it higher); HHS 2026 poverty guidelines; NLIHC Out of Reach 2026 (national two-bedroom Housing Wage $34.73). Full method.
Everything above is a pile: here is the money, here is what it buys. But a household does not receive a pile. It receives — or does not receive — a small amount every month, and the difference compounds into a different life.
One full-time year at the federal minimum wage is $15,080. Twenty years of it arriving at once sounds like a windfall, and it is the number people reach for.
The same total, arriving as $1,257 a month instead. For a household living on a fixed income of $1,600 a month, that is not one large purchase. It is close to twice as much money, every month, for twenty years.
This is why the figures on this page are counted in time rather than dollars. A fortune held still is not a pile that nobody spent. It is a stream that never reached anyone — and the cost of that is not the sum. It is the twenty years.
One year of growth on the fortunes above, paid out as a full-time minimum-wage income, would fund 54.8 million of those households for a year.
You can pay every month for the privilege of being insured and still pay when you need a doctor. Put your own numbers in and see the premium dollars plus the care you paid for out of pocket.
Did you get $62,400.00 dollars worth of healthcare over 8 years?
That is what this example sends toward premiums plus care insurance did not cover across eight years—before denied claims, balance bills, or time lost dealing with the system.
What would you have spent $62,400.00 on in the last 8 years?
You could have seen a doctor (at $150.00 per visit) 416 times.
Americans put $1.64T through private health insurance every year — $4.51B a day.
Where federal law does apply, insurers may keep 15–20% of every premium dollar for administration, marketing and profit. Applied to the whole flow as an upper bound, that is $245B–$330B a year legally permitted never to become anyone's medical care.
Employers pay 72% of employer-sponsored premiums and households the other 28% — but the employer share is compensation too: money that could have been wages. The 15–20% ceiling binds only fully-insured commercial plans; 67% of covered workers are in self-funded employer plans, which the rule does not cover, so the real non-care total is lower than this upper bound.
Sources: CMS National Health Expenditure Accounts (2024 private health-insurance spending, $1.6446T); ACA medical-loss-ratio rule (85% large-group / 80% individual and small-group care floor); KFF Employer Health Benefits Survey 2025. Full method.
Stop feeding them your money and they’ll have to stop giving millions to their “shareholders.”
Important: this calculator exposes costs; it is not a recommendation to cancel coverage. Going without a plan can leave you exposed to catastrophic bills. Compare replacement coverage, public programs, negotiated self-pay rates, and an emergency reserve before making a health-care decision.
At an assumed 4% return, the fortunes on this page grow by $827B a year without anyone working for it. Here is what that one year of growth would pay for, at published project costs.
Costs are published estimates, not quotes: homelessness from the National Alliance to End Homelessness ($9.6B/yr for permanent housing for every sheltered household); high-speed rail at roughly $206M per mile and $105B for California Phase 1; urban light rail at about $165M per mile. A one-time windfall builds things; it does not by itself fund their operating costs forever.
Data: The global snapshot comes from the supplied WealthRank data: 3,414 rows totaling about $20.6663T. Two rows contain malformed country fields, so they remain in “All countries” but are not assigned to a country option.
Human-days: total wealth ÷ ($7.25 × 8). The metric is designed to make scale intuitive. It is not a literal payroll ledger.
Two different years: this page converts days into years two ways on purpose. Where it describes one person working a job to earn a sum, a year is 260 working days — a five-day week, weekends off. Where it says every man, woman and child alive would have to work some length of time, a year is 365 days: that sentence mobilizes the whole species, infants included, so it measures elapsed time rather than employment. Using the 260-day figure there would inflate the result by about 40% under a frame that does not apply.
The $1B line: this simple model assumes each listed person could retain $1B. The excess is a scenario for exploring opportunity cost, not a claim about a specific tax policy.
Currencies: display conversions use a fixed ECB reference-rate snapshot dated Sep 7, 2026 and labeled on this site as last updated Sep 8, 2026. The data remains denominated in U.S. dollars underneath.
Wage inputs: country figures are a 2026 snapshot from wage.is. “Bottom-middle-class proxy” means 60% of the reported country average salary, converted to an hourly figure using 160 hours/month; it is an explicit comparison proxy, not a legal wage. U.S. state figures follow the Department of Labor’s 2026 table. Local options include Seattle’s official $21.30/hour 2026 rate and published Portland metro / New York-area rates.
Lifetime basket: costs are illustrative country-adjusted estimates. Non-housing items use a static World Bank household-consumption price-level index snapshot. The house line uses 90 m² × Numbeo’s country price per square metre snapshot dated Sep 8, 2026; where unavailable, the U.S. benchmark is scaled by the World Bank index. The food line is anchored to the USDA family-of-four food-plan reports; vehicle and fuel costs are anchored to AAA’s vehicle-cost methodology. Utilities use EIA residential energy data. Dental figures reflect the cost variability described by the ADA. Medical, care, travel, furniture, and professional-service lines are transparent illustrative anchors, not quotes or national averages. The list also includes costs people commonly defer rather than avoid — debt payoff, a deposit on a home, retraining, therapy, a funeral, an earlier retirement — priced as illustrative anchors on the same basis. The Ferrari, the private island, the Boeing 787, the Family Dollar chain and the Space Shuttle are deliberately absurd reference points included to show scale; they are quoted at their global sticker price and are not adjusted by local price levels, since they cost the same wherever they are bought. The $1 billion figure for the roughly 8,000-store Family Dollar chain reflects its reported sale price, as compiled by Reader’s Digest; the private island is a representative $50 million listing, not a specific property.
Population figures: the world population of 8.2 billion is the U.S. Census Bureau’s International Database projection for 2026, used only to flag head-counts that exceed everyone alive. The working-age figure of 5.36 billion is the World Bank’s population ages 15–64 series for 2025.
The 4% growth assumption: the live counter applies a flat 4% annual return to the selected wealth pool, spread evenly across the year. It is an illustrative rate, not a forecast and not a market feed. It is deliberately conservative: long-run real equity returns are documented at roughly 4.9% over 200 years (Deutsche Bank long-term asset return study) and 5.2% over 1970–2024 (PWL Capital), so 4% understates rather than inflates the figures on this page. The counter accrues linearly and does not compound within the year.
Public-project costs: the “what a society could buy instead” figures use published estimates and are illustrative comparisons, not costed proposals. Homelessness: National Alliance to End Homelessness ($9.6B/yr to provide permanent housing for every household in emergency shelter). High-speed rail: roughly $206M per mile and $105B for California Phase 1; the Los Angeles–Dallas and Dallas–New York lines apply that per-mile rate to approximate route distances and are illustrative, not surveyed routes. Urban light rail: about $165M per mile. The school-meal and public-university tuition lines multiply approximate enrolment counts by approximate per-student costs and are round illustrative anchors rather than sourced program budgets.
Historical caution: Forbes’ comparable worldwide billionaire list begins in 1987. Earlier years therefore need a different historical reconstruction and should not be presented as equally precise.
Public-investment scenario: the “take it back” section is an illustrative one-time-tax allocation, not a costed government plan. Its categories follow the public goods described by the World Bank’s poverty and social-protection work, UN-Habitat’s housing mandate, WHO’s universal-health-coverage framework, UNODC crime-prevention guidance, and OECD/ITF transport-accessibility research. A one-time windfall can create an endowment and build infrastructure; ending recurring poverty, homelessness, disease, or crime requires durable public policy and operating budgets.
Health-insurance calculator: the example is based on user-provided inputs. Health coverage costs include premiums, deductibles, copayments, coinsurance, and out-of-pocket limits; see HealthCare.gov’s total-cost guidance, out-of-pocket definition, and KFF’s 2025 employer-benefits survey. The $150 office-visit figure is an illustrative self-pay anchor for one primary-care visit, not a quoted or negotiated rate; actual cash prices vary widely by provider and region. This tool is an illustration, not financial or medical advice.
Minimum-wage erosion: the federal minimum has been $7.25 since July 24, 2009 (U.S. Department of Labor), the longest period without an increase since the wage was established; many states set higher floors, so $7.25 is the federal floor rather than a typical prevailing wage. The figure of 40.2% below the February 1968 peak is EPI’s published estimate; note that inflation-adjusted comparisons vary with the price index chosen (CPI-U, CPI-U-RS, CPI-W), which is why this page cites a published figure rather than computing its own. The productivity-indexed figure of about $18.50/hour is EPI’s; CEPR puts the same counterfactual higher ($21.50–$23), and the range between them reflects genuine methodological disagreement, not precision. The poverty comparison uses the 2026 HHS poverty guidelines for a single adult in the 48 contiguous states. The $34.73 two-bedroom Housing Wage is from NLIHC’s Out of Reach 2026. The “$23,400 more a year” and “close to $400,000” figures are this page’s own arithmetic on EPI’s $18.50 counterfactual against $7.25 at 2,080 hours, across the years since 2009; they are illustrative of the gap’s scale, not a published estimate of lost earnings — no authoritative cumulative-loss figure exists.
The income-stream comparison: the “twenty years” section uses one full-time year at the U.S. federal minimum wage ($7.25 × 40 hours × 52 weeks = $15,080) and a representative fixed monthly income of $1,600, a figure in the range of Social Security disability payments. Neither is a forecast or a claim about any particular household; they are round anchors chosen to show a ratio — a second income of that size roughly doubles a household at that level. The year-by-year examples are illustrative of well-documented effects (deferred dental care costing more later, food deserts pricing staples above supermarket rates, transport access widening the set of reachable jobs); they are not modelled outcomes, and this page deliberately does not compute a “quality of life” score. The household count divides one year of growth on the selected pool by that same annual minimum-wage income.
National premium scale: total U.S. private health-insurance spending of $1.6446 trillion (2024) is from the CMS National Health Expenditure Accounts; the 72% employer / 28% household split of employer-sponsored spending is from the same source. The 15–20% figure is not an estimate of waste: it is the legal ceiling on the non-care share, set by the ACA’s medical-loss-ratio rule, which requires insurers to spend at least 85% of large-group premiums (80% for individual and small-group plans) on care and quality improvement or rebate the difference. Most premium dollars do pay medical claims; this line measures the portion that legally never has to, which covers administration, marketing and profit together — not executive pay alone. That ceiling governs fully-insured commercial coverage only. Self-funded employer plans — which hold 67% of covered workers per KFF 2025 — sit inside the CMS total but outside the rule, and CMS does not split fully-insured from self-funded dollars within that line, so the range cannot be recomputed on the covered share. It is therefore presented as an upper bound on the non-care portion, not a measured figure. The CMS line is also total private-health-insurance expenditure (benefits paid plus the net cost of insurance), which is why this page says money put “through” private insurance rather than “premiums paid”. Per-worker premium averages ($9,325 single, $26,993 family in 2025) come from KFF’s Employer Health Benefits Survey and are deliberately not multiplied by the 154 million covered people, which would double-count dependents.